
Only two actively managed North American equity strategies registered for distribution in Hong Kong and/or Singapore are beating their respective benchmarks over five years, according to data compiled by FSA.
Out of 219 mutual funds in the North American equity sector with a five-year track record, only 15 strategies have returns above that of the widely used benchmark S&P 500 index.
Of these 15 strategies, only six were actively managed. The rest were exchange-traded-funds (ETFs) tracking various US equity indices such as the Russell 1000 Growth index, the MSCI USA SRI index and the S&P 100 index.
The best performing strategies by far were passive exchange traded funds (ETFs) tracking the technology-heavy Nasdaq 100 index.
Below is a table showing the 15 funds with returns above the five-year S&P 500 index return of 64.09%.
| Fund | 5yr return (%) | Benchmark |
| iShares NASDAQ 100 UCITS ETF | 107.57 | Nasdaq 100 Index |
| iShares Russell 1000 Growth ETF | 86.96 | Russell 1000 Growth |
| JPM US Growth | 85.4 | Russell 1000 Growth |
| Comgest Growth America | 75.81 | S&P 500 |
| iShares MSCI USA SRI UCITS ETF | 74.2 | MSCI USA SRI Select Reduced Fossil Fuels Index |
| Xtrackers MSCI USA ESG UCITS ETF | 73.69 | MSCI USA Low Carbon SRI Leaders Index |
| iShares S&P 100 ETF | 71.18 | S&P 100 Index |
| Natixis Loomis Sayles US Growth Equity | 70.93 | S&P 500 |
| iShares Core S&P U.S. Growth ETF | 68.46 | S&P 900 Growth |
| iShares MSCI KLD 400 Social ETF | 67.66 | MSCI KLD 400 Social Index |
| Ossiam Shiller Barclays Cape US Sector Value | 67.01 | Shiller Barclays CAPE© US Sector Value |
| Amundi Pioneer US Equity Fundamental Growth | 65.38 | Russell 1000 Growth |
| iShares MSCI USA ESG Select ETF | 64.58 | MSCI USA Extended ESG Select Index |
| AB American Growth Portfolio | 64.54 | Russell 1000 Growth |
| PGIM Jennison US Growth | 64.29 | Russell 1000 Growth |
Comgest Growth America stands out as one of only two actively managed funds that outperformed its S&P 500 benchmark with a 75.81% return.
The managers Christophe Nagy, Justin Streeter, Louis Citroën and Remi Adam run a concentrated portfolio relative to the index, with just 27 holdings. Its top 10 make up well over half of its portfolio at 58.3%.
The $714m fund has benefited from its long-held overweight position in American pharmaceutical company Eli Lilly, which has increased fivefold in value over the past five-years. It also holds large positions in Microsoft and Apple.
The other actively managed fund ahead of its S&P 500 benchmark was the $2.6bn Loomis Sayles US Growth fund with a return of 70.93%.
Run by Aziz Hamzaogullari, the fund also runs a concentrated portfolio of 37 stocks with a low turnover, long-term approach. It has benefitted from a position in Nvidia, which it has held since early 2019 and has increased almost tenfold in value since.
As their name suggests, both funds have a growth-style tilt to their investment strategies and despite the recent interest rate hikes hurting the valuations of long-dated assets which include growth equities, they have still managed to outperform.
The other four actively managed funds outperforming the S&P 500 in the list above were still underperforming their benchmark: the Russell 1000 Growth index, which has a higher performance hurdle of 89.7% over five years.
The dominance of US tech stocks
When it comes to the passive ETFs that make up most of the list above, their performance can be mostly attributed to the strong returns from the largest US tech companies.
The US equity market over the past several years has been largely driven by the strong performance of its largest constituents known as the FAANG: Facebook (renamed as Meta), Apple, Amazon, Netflix and Google (also known as Alphabet).
Despite the poor performance of Netflix, the strong returns of Microsoft, Nvidia and Tesla more recently has led to a new name for the index-dominating companies: the ‘Magnificent Seven’.
The largest constituents have been a strong driver of its outperformance in both the short-run and over the long-run. For example, over the past five years the Nasdaq 100 equal weighted index is up only 71.55%, versus 112.36% from the market-cap weighted index.
But the narrow performance of the ‘Magnificent Seven’ has been more pronounced this year given the recent boom around artificial intelligence and signs of moderating inflation.
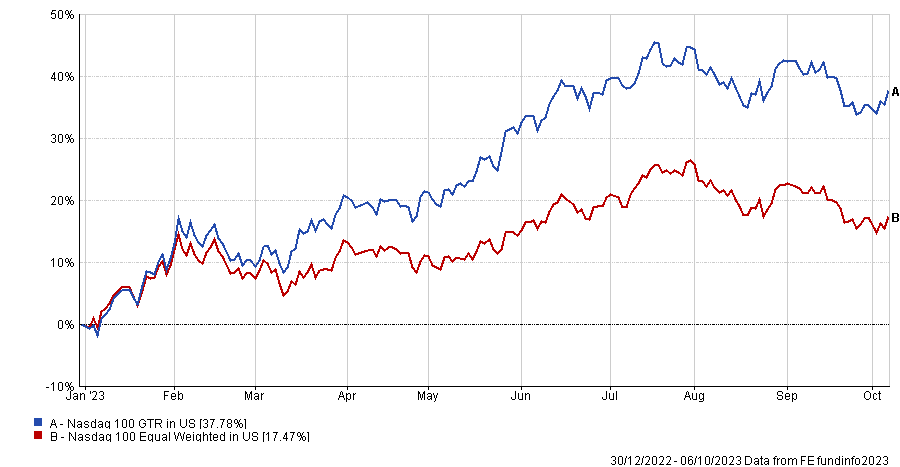
Year-to-date the Nasdaq 100 equal weighted index is up just 17.47% compared to 37.78% from the market-cap weighted index.
One outlier in the list of funds above is the Ossiam Shiller Barclays Cape US Sector Value fund. It has outperformed the S&P 500 index but is designed to track the Shiller Barclays CAPE US Sector Value Index.
The fund selects sectors of the US equity market based on the CAPE (Cyclically Adjusted Price-to-Earnings) ratio, popularised by Yale University’s professor Robert Shiller, with the aim to find potentially undervalued sectors – the only fund in the list above with a value bias.