


The FSA Spy market buzz – 13 December 2024
M&G’s positive outlook; Wisdom from Schroders’s podcast; Alliance Bernstein on the power of curiosity; Janus Henderson on responsible AI; China’s retirement revolution; Apple and much more.
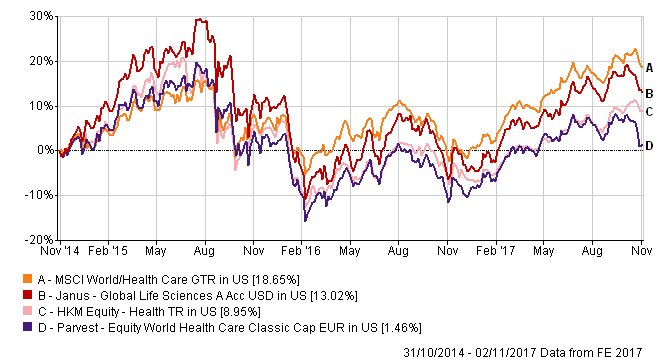
Both funds use the MSCI World Health Care Index as their benchmarks, with the Parvest fund using the Ucits III-compliant 10/40 version of the index, which imposes concentration limits (performance of both indices was identical over the three-year period ending 31 October).
One of the main factors in the performance of the two funds is exposure to the sub-industries in healthcare, Ng said.
The Janus fund outperformed the benchmark and the Parvest fund by a healthy margin in 2012-14, thanks to its bias toward biotech. “In 2012-14, the biotech sector performed very well.
“After 2015, you don’t see a very big difference between the performance of biotechnology and pharmaceuticals and in 2016, both biotech and pharmaceuticals underperformed,” he said.
As a result, in 2015 and 2016 both funds underperformed.
So far in 2017, both products have delivered double-digit returns, with the Janus fund doing slightly better than the index and Parvest underperforming it.
Both funds have a negative alpha, high beta, and volatility exceeding that of the index, as measured on a three-year basis. While the measurements for the five-year period, which includes the biotech boom of 2012-14, put the Janus fund in a better light with alpha of 0.40 (Parvest’s remains negative at -4.98), the numbers underscore the difficulties in outperforming the index in a risky and volatile industry.
Biotech carries high risk. “Biotech companies require a lot of resources for research and development, a sustainable investment before they pay the money back” said Ng. This results in higher risk and volatility.
| Janus | Parvest | MSCI World Health Care Index | |
| 3-year return (cumulative) | 13.52% | 1.20% | 18.87% |
| 1-year return | 20.13% | 12.46% | 19.80% |
| 3-year Alpha | -2.47 | -5.76 | |
| 3-year Beta | 1.25 | 1.14 | |
| 3-year Sharpe Ratio | 0.05 | 0.00 | |
| 3-year Volatility | 16.44 | 14.64 | 12.06 |
Data: FE, 31 October 2017, returns in US dollars, ratios are annualised
 Your Questions Answered by Federated Hermes Impact Opportunities
 Federated Hermes SDG Engagement Equity: 2021 H1 Report
 Despite headwinds, ESG continues to perform
 Impact opportunities: investing to limit biodiversity loss
 Smartphones on wheels
 Conditions in the high yield market
 Nuveen broadens income sources via private capital and real assets
 Step up your portfolio by doubling down on sectors set for long-term growth
 Unmasking the dividend opportunity
 How can a sustainable approach also ensure you don’t compromise performance?

M&G’s positive outlook; Wisdom from Schroders’s podcast; Alliance Bernstein on the power of curiosity; Janus Henderson on responsible AI; China’s retirement revolution; Apple and much more.
Part of the Mark Allen Group.
