
ETFs have become one of the fastest growing and the most innovative categories in the investment industry. Since 2003, the sector has enjoyed a compound annual growth rate of 24% to reach $12trn and with the proliferation of active ETFs, leading market participants such as JP Morgan Asset Management (JPMAM), forecast AUM of $20trn by 2027.
One clear attraction for investors is their cost. Management fees are typically far less than those charged by Ucits and some investors also gain tax benefits from their geographical location. Greater transparency of stock holdings through daily disclosure is an added appeal that gives active ETFs an edge over actively managed mutual funds.
Equity strategies still comprise most (around 75%) of all ETFs, but fixed income ETFs are rapidly pulling in more flows, accounting for more than 40% of inflows last year, according to JPMAM.
Yet, passive equity strategies remain the bedrock of the industry and BlackRock’s iShare stable is a leader in the sector and perhaps the most familiar name to retail investors.
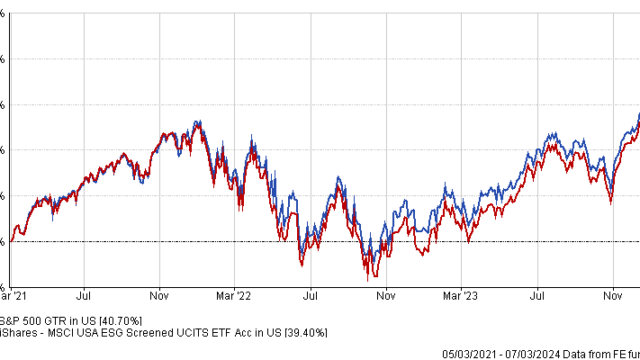
This week, Monika Calay, director of passive strategies research at Morningstar, compares the iShares Core S&P500 Ucits ETF and the iShares MSCI USA ESG Screened Ucits ETF.
| iShares Core S&P500 | iShares MSCI USA ESG | |
| Size | $15.9bn | $7bn |
| Inception | 2002 | 2018 |
| Manager | BlackRock | BlackRock |
| Three-year cumulative return | 40.70% | 39.40% |
| Three-year annualised return | 11.90% | 11.56% |
| Three-year annualised alpha | 0.00 | 3.01 |
| Three-year annualised volatility | 16.66% | 17.44% |
| Three-year information ratio | 0.00 | 0.97 |
| FE Crown fund rating | **** | – |
| Morningstar rating | **** (Gold) | **** (Gold) |
| OCF (retail share class) | 0.07% | 0.07% |
Investment Approach
The iShares Core S&P 500 ETF seeks to track the S&P 500 index, which includes the 500 largest US companies. Constituents are determined by a committee.
Meanwhile, the iShares MSCI USA ESG Screened ETF tracks the MSCI USA ESG Screened index. It excludes companies involved in controversial industries like weapons, tobacco, fossil fuels and screens out firms with very low ESG scores or severe controversies.
“The S&P 500 ETF does not have any explicit ESG screens. The index has a slight quality tilt by requiring positive earnings to be included,” said Calay.
The ESG Screened ETF filters out companies with high ESG risks and controversial business involvement, giving it more of an ESG focus than the S&P 500 ETF. However, the screening eliminates only about 50-60 companies from the parent index, the MSCI USA.
Both ETFs hold approximately 500 stocks. They also have similar sector allocations, as the ESG screens only modestly change the portfolio composition, Calay said.
The ESG Screened ETF has slightly higher exposure to IT (33.67% vs 31.19%) and slightly less exposure to energy (1.99% vs 3.77%) than the S&P 500 ETF, as of March 12, 2023.
“Despite the light exclusion the ESG screen makes, iShares MSCI USA ESG Screened ETF has managed to offer an improved ESG profile versus the strategy’s non-ESG equivalent,” said Calay. “As of now, the fund has an average Morningstar sustainability rating of 4-globes.”
“The rating is a measure of how well the companies held by a fund are managing their ESG risks and opportunities compared with similar funds, including funds without an explicit sustainability mandate,” she said.
“Again, while the screen does offer an improved ESG profile, it just might not be sufficient for investors who are looking for more ESG commitment.”
Fund characteristics
Sector allocation:
| iShares Core S&P500 | iShares MSCI USA ESG | |
| Cyclical | 27.55% | 29.32% |
| Basic materials | 2.08% | 2.14% |
| Consumer cyclical | 10.74% | 11.62% |
| Financial services | 12.40% | 12.98% |
| Real estate | 2.33% | 2.58% |
| Sensitive | 51.90% | 52.95% |
| Communication services | 8.87% | 9.60% |
| Energy | 3.73% | 1.92% |
| Industrials | 8.19% | 7.45% |
| Technology | 31.11% | 33.98% |
| Defensive | 20.56% | 17.72% |
| Consumer defensive | 5.88% | 3.25% |
| Healthcare | 12.58% | 13.36% |
| Utilities | 2.10% | 1.11% |
Top 10 holdings:
| iShares Core S&P500 | iShares MSCI USA ESG | ||
| Microsoft | 7.17% | Microsoft | 7.06% |
| Apple | 6.16% | Apple | 6.41% |
| Nvidia | 4.56% | Nvidia | 4.72% |
| Amazon | 3.75% | Amazon | 3.97% |
| Meta Platforms | 2.54% | Meta Platforms | 2.63% |
| Alphabet | 1.91% | Alphabet | 1.98% |
| Berkshire Hathaway | 1.74% | Alphabet | 1.98% |
| Alphabet | 1.62% | Eli Lilly | 1.47% |
| Eli Lilly | 1.40% | Tesla | 1.40% |
| Broadcom | 1.33% | Broadcom | 1.40% |
Performance
If controversial industries, such as tobacco, weapons or fossil fuels are outperforming the broader market, the iShares Core S&P 500 ETF may have an advantage over the ESG Screened ETF, according to Calay. “Since the ESG ETF excludes these industries, it might miss out on their strong returns,” she said.
“The slight differences in sector allocations between the two ETFs could lead to performance disparities in certain market conditions,” Calay said.
For example, if the energy sector is outperforming, the iShares Core S&P 500 ETF might have an advantage due to its higher exposure to energy stocks (3.77% vs 1.99% for the ESG Screened ETF).
“Given the significant overlap in holdings and similar sector exposure, both ETFs are likely to perform similarly in most broad market conditions,” Clay said.
Both funds have outperformed the category average over the past five years and are ranked in the top quartile of their peer group.
“The difference in volatility between the two ETFs is expected to be relatively small, given their significant overlap in holdings and sector exposure,” she said.
The iShares MSCI USA ESG Screened ETF has a less stringent ESG screening process compared to other ESG-focused funds.
Discrete calendar year performance
| Fund | YTD* | 2023 | 2022 | 2021 | 2020 | 2019 |
| iShares Core S&P500 | 8.89% | 25.90% | -18.33% | 28.37% | 18.10% | 31.04% |
| iShares MSCI USA ESG | 8.43% | 29.78% | -20.96% | 27.37% | 22.34% | 31.50% |
Manager Review
These funds are both managed by the same team.
“iShares has a seasoned passive management team befitting the dominant ETF provider in Europe,” said Calay.
The well-resourced EMEA portfolio management team consists of approximately 30 portfolio managers. The team has experienced low turnover and can leverage market-leading technology while managing funds.
As a standard industry practice, the funds are managed on a team basis.
“This is to ensure that portfolio managers’ absences and departures have no impact on the day-to-day fund management,” said Calay.
“We have assigned an Above Average People Pillar rating to the managers of these funds.”
Fees
Both funds have ongoing charges of 0.07%. This is well below the category median fee of 0.9%.
Conclusion
Both funds have been awarded a Morningstar medalist rating of gold.
“The US equity market is highly liquid and efficient, meaning that material information is quickly incorporated into stock prices,” said Calay.
“This limits the room for active managers to add meaningful value and makes broadly diversified, low-cost passive strategies the default option for investors seeking this market exposure,” she concluded.