


The FSA Spy market buzz – 13 June 2025
Fund costs are sky high; Jupiter is using its shoes; Shenzhen and Hong Kong cosy up some more; A juicy space IPO; Global currencies and the dollar’s death; Charts from left to right and much more.
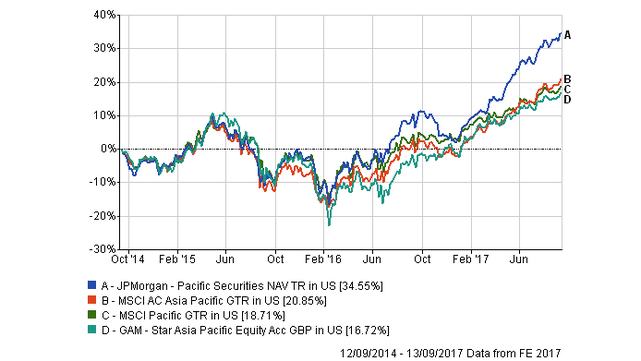
The chart shows the cumulative three-year performance of the funds and their respective benchmarks. The GAM fund underperformed its benchmark, the MSCI Pacific, while the JP Morgan fund outperformed its benchmark by a large percentage, according to FE data.
Ng said that the GAM fund’s underperformance is attributable to some of its holdings in financials, energy and materials, adding that material and energy prices have been on a downward trend.
The JP Morgan’s product outperformance can be attributed to the managers’ stock selection in Australia, Japan, China, India and Korea, according to Ng.
The fund’s overweight positions in Tencent, Alibaba and AIA significantly drove performance, he added.
Both the GAM fund and the JP Morgan fund are more volatile than their benchmark indices, according to FE data.
| Fund / benchmark index |
Volatility |
| GAM Star Asia Pacific Equity Fund |
16.32 |
| MSCI Pacific Index |
14.24 |
| JP Morgan Pacific Securities Fund |
14 |
| MSCI AC Asia Pacific Index |
13.96 |
However, the volatility gap between the GAM fund and its benchmark index is bigger than that of the JP Morgan fund, Ng noted.
The GAM product may be more volatile because of its larger allocation to Japan and to cyclical stocks such as financials and industrials, he said.
 Step up your portfolio by doubling down on sectors set for long-term growth
 Driving decarbonisation: how to access new forms of alpha
 Nuveen broadens income sources via private capital and real assets
 Impact opportunities: investing to limit biodiversity loss
 Unmasking the dividend opportunity
 Despite headwinds, ESG continues to perform
 Investment Ideas for 2021: Explore the untapped potential in China Small Companies
 Ninety One: Finding opportunities in times of change
 Sustainable Investing in Changing Market Conditions
 Fixed income – making ground in ESG as ETFs see rapid growth in AUM

Fund costs are sky high; Jupiter is using its shoes; Shenzhen and Hong Kong cosy up some more; A juicy space IPO; Global currencies and the dollar’s death; Charts from left to right and much more.
Part of the Mark Allen Group.
