The FSA Spy market buzz – 16 May 2025
Playing monopoly with ETFs; Eastspring is worrying about loss aversion; Family office explosion; SGX wants more action; The Fear and Greed Index; Retail investors plough on; Deepfake fraud and much more.
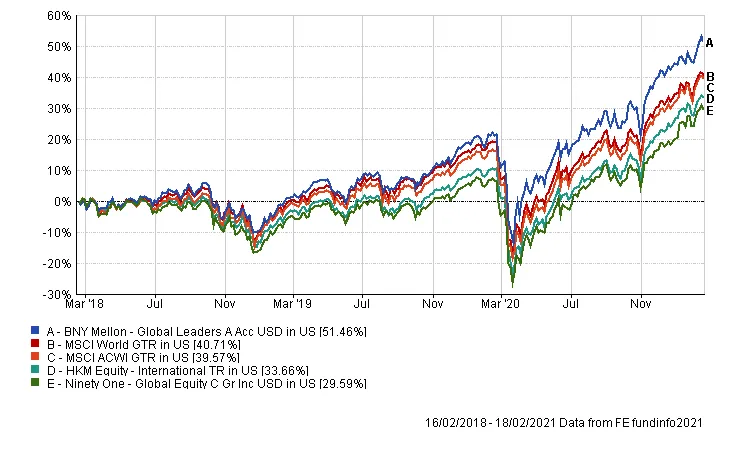
Both funds have been a consistent performer for each calendar year, with the exception of 2018, when both offerings had negative returns, according to McDermott.
While the funds have performed in a similar fashion, the BNY Mellon fund has slightly outperformed in recent years when growth stocks have led the market.
Annual calendar performance (%)
| Fund / index / sector | YTD 2021 | 2020 | 2019 | 2018 | 2017 |
| BNY Mellon Global Leaders | 4.39 | 22.82 | 29.35 | -7.45 | 22.58 |
| Index: MSCI World | 4.86 | 16.5 | 28.4 | -8.2 | 23.07 |
| Ninety One Global Equity | 7.56 | 15.8 | 23.72 | -14.74 | 22.76 |
| Index: MSCI AC World | 5.81 | 16.82 | 27.3 | -8.93 | 24.62 |
| Sector: Global equity | 5.84 | 17.17 | 24.01 | -11.83 | 22.2 |
In addition, although the BNY Mellon fund has a more growth-style bias, McDermott believes that the product can outperform when markets are falling.
“This is supported by the fact it only fell 7.5% in 2018,” he said.
Its volatility has been lower as well given its bias toward high quality companies, despite being more concentrated.
“The BNY Mellon fund is very high conviction, but over the past years, its maximum drawdown and volatility measure has been slightly lower than the Ninety One fund.”
Three-year annualised volatility
| Fund / index / sector | Volatility | Sharpe |
| BNY Mellon Global Leaders | 19.84 | 0.59 |
| Index: MSCI World | 20.71 | |
| Ninety One Global Equity | 21.07 | 0.27 |
| Index: MSCI AC World | 20.2 |
 From “FAANG” to “MAMAA” to “Magnificent 7” – what’s in a name?
 Smartphones on wheels
 Investors turn to real estate for alternative income
 China bonds: plugging the yield gap
 Impact opportunities: investing to limit biodiversity loss
 Driving decarbonisation: how to access new forms of alpha
 Step up your portfolio by doubling down on sectors set for long-term growth
 Your Questions Answered by Federated Hermes Impact Opportunities
 Who’s afraid of higher interest rates?
 Despite headwinds, ESG continues to perform

Playing monopoly with ETFs; Eastspring is worrying about loss aversion; Family office explosion; SGX wants more action; The Fear and Greed Index; Retail investors plough on; Deepfake fraud and much more.
Part of the Mark Allen Group.