


The FSA Spy market buzz – 9 May 2025
Invesco gets contrarian; Popes and the S&P 500 performance; Jim Cramer’s certainty; Negative yields; AI is everywhere; Natixis considers the next decade; Google’s search woes and much more.
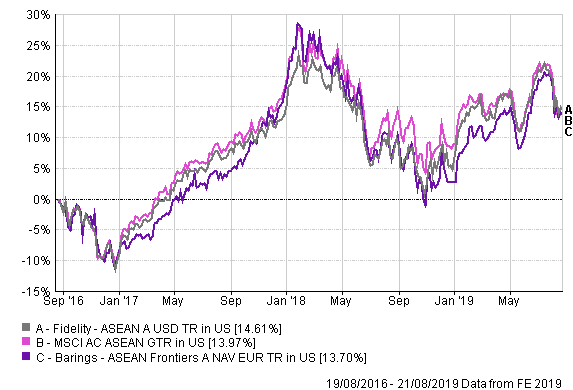
Ng pointed out that the Barings fund has been more volatile than both the Fidelity product and the index.
“If you look at 2018, for example, the Barings fund underperformed by a huge margin relative to the benchmark, and this year it has rebounded and performed better than the index and the Fidelity fund.”
Annual discreet calendar performance
| Fund / benchmark |
YTD 2019 |
2018 | 2017 | 2016 | 2015 |
2014 |
| Barings Asean Frontiers |
9.89 |
-13.17 | 31.09 | 5.23 | -11.7 |
8.57 |
| Fidelity Asean |
7.23 |
-7.27 | 26.53 | 4.84 | -17.65 |
6.97 |
| MSCI AC Asean Index |
4.27 |
-8.36 | 30.14 | 6.2 | -18.35 |
6.42 |
Three-year annualised volatility
| Fund / Index |
Volatility |
Sharpe ratio |
| Barings Asean Frontiers |
11.78 |
0.08 |
| Fidelity Asean |
10.78 |
0.11 |
| MSCI AC Asean Index |
11.01 |
0.08 |
Ng said that the more concentrated portfolio of the Barings fund is a driver of the higher volatility.
Turning to the Fidelity fund, he said its more diversified portfolio has helped ease volatility relative to the index.. In addition, the previous manager’s investment style, which avoided huge off-benchmark bets, contributed to lower volatility.
 How can a sustainable approach also ensure you don’t compromise performance?
 M&G Episode Macro shines after tough year
 Thematic investment series: Innovative transformation cuts across “old” and “new” economy companies
 Nuveen broadens income sources via private capital and real assets
 China bonds: plugging the yield gap
 Your Questions Answered by Federated Hermes Impact Opportunities
 Investment Ideas for 2021: Explore the untapped potential in China Small Companies
Riding the wave of alternative income amongst HNWIs in APAC
Investment Ideas for 2021: Explore the untapped potential in China Small Companies
Riding the wave of alternative income amongst HNWIs in APAC
 Sustainable Investing in Changing Market Conditions
 China’s post-pandemic growth gathers pace

Invesco gets contrarian; Popes and the S&P 500 performance; Jim Cramer’s certainty; Negative yields; AI is everywhere; Natixis considers the next decade; Google’s search woes and much more.
Part of the Mark Allen Group.
