
Introduction
With fundraising challenging across most markets last year, funds investing within the Asia Pacific region were no exception in losing favour among investors.
According to a report from Cerulli, equity funds in Australia, China, Taiwan, Hong Kong and Singapore all suffered double-digit decreases in assets under management for the first eleven months in 2022, as investors’ confidence remained low.
“However, lower equity valuations caused by prolonged weak market sentiments have created many value opportunities in growth sectors,” said Cerulli in the report.
It observed that there is growing risk appetite in the region, albeit in the initial stages and in favour of Chinese equities.

The view is echoed by Isaac Poole, chief investment officer at Oreana Financial Services, who believes that Asia stacks up relatively well as we enter a phase in the global economic cycle that is punctuated by downside economic risk coming out of the US.
“China has recently exited a deep recession that lasted for most of 2022. A recovery will be supportive of broader Asia,” he said.
“But on the other hand, a recession in the US will prove painful globally and that will result in relative winners and losers through Asia.”
Against this background, FSA asked Poole to select two Asia Pacific ex-Japan funds for comparison. He chose the FSSA Asian Equity Plus fund and the Schroder International Selection Fund Asian Total Return fund.
| FSSA | Schroder | |
| Size | $6.60bn | $4.56bn |
| Inception | 2005 | 2007 |
| Managers | Martin Lau, Richard Jones | King Fuei Lee, Robin Parbrook |
| Three-year cumulative return | 3.73% | 5.89% |
| Three-year annualised return | 9.27% | 13.04% |
| Three-year annualised alpha | 0.02 | 3.23 |
| Three-year annualised volatility | 17.02% | 17.99% |
| Three-year information ratio | -0.10 | 0.56 |
| Morningstar star rating | **** | **** |
| Morningstar analyst rating | Silver | Gold |
| FE Crown fund rating | *** | *** |
| OCF (retail share class) | 1.57% | 1.30% |
Investment approach
The two funds are quite similar in some of their investment processes, noted Poole, as both of them adopt a bottom-up stock picking approach and have low annual turnover.
While both products can differ substantially from the MSCI Asia Pacific ex-Japan index, the FSSA fund consists of between 40 and 70 names, while the Schroders portfolio allocates to 50 to 60 stocks, he noted.
“Both funds have a clear, repeatable process that has been implemented for more than a decade,” he said.
The Schroders fund has a more obvious top-down filter, with a macro focus on considering relative valuations of the different countries in the index.
“This process emphasises downside resilience – something important in an Asian focused fund where volatility can be high,” said Poole.
“The managers can selectively use hedging strategies to manage risk and retain their focus on absolute returns and high conviction ideas.”
The stock selection process aims to target strong or improving return on invested capital relative to the weighted average cost of capital.
“The process focuses on absolute returns – something that can be challenging in an Asian market but does require good risk management and high conviction.”
isaac poole, oreana financial services
Meanwhile, the FSSA fund has a clear emphasis on quality growth at reasonable valuations.
“Quality includes a focus on management styles that exhibit good governance, alignment with shareholders and solid capital allocation track records,” said Poole.
“The process focuses on absolute returns – something that can be challenging in an Asian market but does require good risk management and high conviction.”
The fund tends to be investing in large cap equities with a blend of value and growth and the investment team work collaboratively and cover stocks across different sectors, although there does tend to be a geographic focus.
In terms of geographical allocation, both funds are overweight Hong Kong stocks when compared with the benchmark.
More than half of the FSSA fund is exposed to China, India and Hong Kong, while the Schroders fund overweighs Taiwan and Hong Kong and materially underweighs China, Poole noted.
He also pointed out that the FSSA fund has the willingness to invest in Japan with high quality companies, which has added value through time.
Fund characteristics
Sector allocation:
| FSSA | Schroders | ||
| Financials | 26.4% | Info tech | 33.1% |
| Information Technology | 17.2% | Financials | 23.3% |
| Consumer Discretionary | 13.2% | Consumer Discretionary | 11.6% |
| Consumer Staples | 13.0% | Health Care | 7.3% |
| Health Care | 10.9% | Communication | 7.2% |
| Industrials | 6.6% | Materials | 6.5% |
| Communication Services | 6.4% | Industrials | 5.9% |
| Real Estate | 2.2% | Real estate | 3.4% |
| Materials | 1.7% | Consumer Staples | 1.2% |
| Utilities | 1.6% | Hedges | -2.5% |
| Cash | 0.8% |
Top 5 holdings:
| FSSA | weighting | Schroders | weighting |
| HDFC Bank | 5.9% | Taiwan Semiconductor | 9.3% |
| Taiwan Semiconductor | 4.8% | Samsung Electronics | 6.9% |
| Tencent Holdings | 4.5% | DBS Group | 3.4% |
| Midea Group | 3.6% | Tencent | 3.3% |
| Ping An Insurance Company | 3.5% | AIA | 2.7% |
Country Allocation:
| FSSA | weighting | Schroders | weighting |
| China | 29.0% | Taiwan | 18.2% |
| India | 16.6% | Australia | 16.9% |
| Taiwan | 9.3% | India | 13.4% |
| Hong Kong | 7.9% | Hong Kong | 11.8% |
| Japan | 7.8% | Singapore | 10.0% |
| South Korea | 7.0% | Korea | 8.8% |
| Singapore | 5.6% | China | 6.0% |
| Indonesia | 4.8% | United Kingdom | 3.0% |
| Australia | 3.4% | United States | 2.6% |
| Other | 7.6% | Indonesia | 2.1% |
| Cash | 0.8% | France | 1.9% |
| Vietnam | 1.2% | ||
| Other | 1.1% |
Performance
Despite challenging market environments over the past three years, both funds have delivered attractive returns during the period.
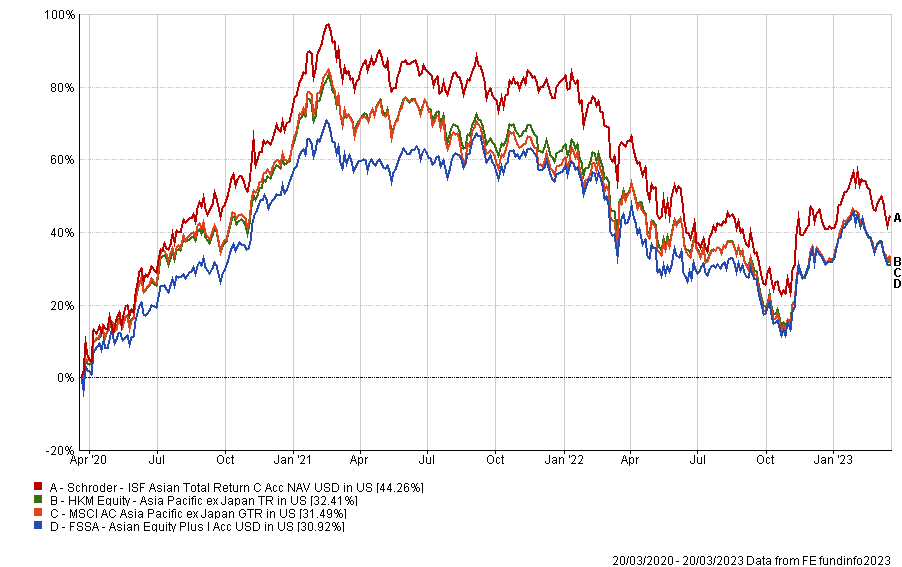
According to FE fundinfo data, the Schroder ISF Asian Total Return fund outperformed both the sector and index average with a three-year cumulative return of 44.26%, while the FSSA fund posted a return of 30.92% for the same period of time.
This is compared with the Asia Pacific ex-Japan sector average of 32.41% and the MSCI AC Asia Pacific ex-Japan index returned 31.49%.
“Both funds have delivered very good long-term returns and alpha, with relatively low downside capture,” said Poole.
“Both funds’ performance links clearly to their process and philosophy, indicating these are good sources of durable alpha.”
He added that FSSA performed better through a challenging 2022 and has delivered somewhat more downside protection, with a modestly lower volatility in recent times.
In fact, when looking at 2022 alone, the FSSA fund showed more resilience with an annualised return of -15.84%, which is significantly better than the sector average (-19.04%), the index average (-19.35%) and the Schroders fund (-23.34%), according to FE fundinfo.
The FSSA fund’s three-year cumulative volatility was 17.02%, while that of the Schroders fund was 17.99%.
“The focus on quality and growth at reasonable valuation has helped the fund protect during challenging periods for the asset class, while delivering solid alpha over a long period of time,” he said.
“Downside capture has been meaningfully below peers on average, and this has helped towards long-run outperformance.”
The fund’s focus on quality has resulted in zero allocation to the energy sector, which has in turn hurt the fund’s relative performance in 2022.
Nevertheless, the fund outperformed the index as stock picking added significant value, said Poole.
Consistent with its investment philosophy of reducing the risk of losing money, the fund tends to have lower standard deviation, resulting in better performance during downturn years, such as 2018, 2021 and 2022.
On the other hand, Schroders’ investment philosophy focusing on quality, absolute return and downside resilience has helped the strategy deliver strong returns through different cycles, Poole noted.
“The portfolio has lagged the index sometimes during up markets, but there has been a consistent alpha generation in line with a strong, clear process.”
The fund underperformed its FSSA competitor, the benchmark and the index in 2022 due to its exposure to tech names, which were sold off broadly.
“The portfolio offered somewhat less downside protection through this period, as the strategy’s hedging process was more costly to implement. But longer-term performance continues to comfortably beat the benchmark,” Poole added.
Both funds’ performance relate clearly to their processes and philosophy, which indicate that they are good sources of durable alpha.
Discrete calendar year performance
| Fund/Sector | YTD* | 2022 | 2021 | 2020 | 2019 | 2018 |
| FSSA | -1.15% | -15.84% | 0.96% | 20.70% | 18.63% | -5.44% |
| Schroders | 2.65% | -22.91% | 4.66% | 30.98% | 19.48% | -13.68% |
| Equity – Asia Pacific ex Japan | -0.81% | -17.19% | -2.65% | 22.75% | 19.48% | 19.48% |
Manager review
The two funds are led by fund managers with good experience and long tenure.
The FSSA fund has been managed by Martin Lau since July 2003, supported by 20 investment professionals with 12 years of experience and seven years with the firm on average.
“The long tenure means the philosophy and process is stable,” said Poole.
“This is a very strong team, although stability is important and the recent turnover bears watching.”
Although the team lost four analysts last year, the process that includes generalist analysts albeit with a geographic focus helps manage the headcount loss, he added.
Meanwhile, Robin Parbrook and King Fuei Lee have managed the Schroders strategy since its inception in November 2007.
“Parbrook and Lee complement each other with Asian, Australian and quantitative expertise split between them,” said Poole.
Both of them are incredibly loyal and have dedicated their entire 20-plus-year investment careers to Schroders.
The duo is supported by 39 analysts, with 16 years of experience on average and eight years of firm tenure.
The team has seen some turnover but there is long-term stability and a wealth of talent and skills that continue to support the process.
Commenting on both teams, Poole said, “the investment philosophies are clearly well understood by each team and implemented. These are among the best equipped Asian equity teams out there.”
Conclusion
Both funds were evaluated similarly by Morningstar, with both receiving four stars based on historical returns.
Thanks to a better three-year cumulative return, the Schroders fund got a gold analyst rating, while the FSSA fund was awarded a silver forward-looking analyst rating.
FE Fundinfo, which bases its assessment on a fund’s three-year history of delivering alpha, minimising relative volatility and producing consistent returns, gave both funds a three crown rating.
Poole believes both funds are great to have in a portfolio and could form a core Asian equities exposure for a diversified portfolio.
The two products have a really clear process and philosophy that has consistently translated into solid alpha with a focus on risk.
“The absolute return focus delivers high conviction portfolios through time, led by portfolio managers who continue to be at the top of the field after more than a decade at the helm of their respective strategies,” he said.
“In an asset class that can be quite volatile, the focus on downside protection is attractive from both strategies.”