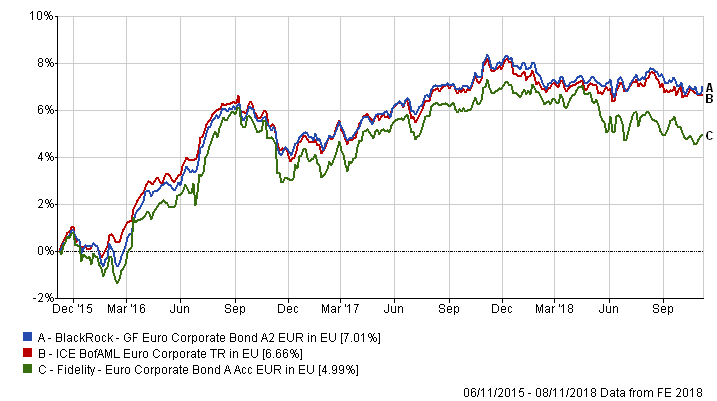
The three-year performance of the Blackrock and Fidelity funds versus their benchmark index.
Performance
Dobrescu believes that both the Blackrock and Fidelity funds do well on an absolute return basis. In addition, both products have consistently been in the top first or second quartiles in their category.
She added that the aim of both funds is to outperform the benchmark regardless of the current market environment.
“Both expect that they will do well in either a bull or bear credit market.”
Annual discreet calendar performance (%)
| Fund / benchmark |
2018
|
2017 |
2016 |
2015 |
2014 |
2013
|
| BlackRock GF Euro Corporate Bond |
-0.66
|
2.53 |
4.86 |
0.39 |
7.78 |
2.22
|
| Fidelity Euro Corporate Bond |
-1.55
|
2.16 |
4.95 |
-0.84 |
9.33 |
2.10
|
| Index : ICE BofAML Euro Corporate |
-0.72
|
2.42 |
4.75 |
-0.43 |
8.25 |
2.39
|
Source: FE Analytics
However, Dobrescu noted the funds’ difference in volatility.
“The Fidelity fund’s volatility has been more elevated,” she said, adding that it is due to the overweight in financials.
| Fund / Index |
Year-to-date Volatility
|
| Blackrock GF Euro Corporate Bond |
1.62
|
| Fidelity Euro Corporate Bond |
2.41
|
| ICE BofAML Euro Corporate |
1.39
|
Source: FE Analytics
“For that reason, risk-adjusted performance is not as quite impressive on the Fidelity fund as it is on the Blackrock fund,” she said, adding that the Blackrock product has a Sharpe ratio, which measures risk-adjusted performance, higher than the Fidelity fund and the benchmark.
| Fund / Index |
Three-year Sharpe ratio
|
| Blackrock GF Euro Corporate Bond |
1.58
|
| Fidelity Euro Corporate Bond |
0.98
|
| ICE BofAML Euro Corporate |
1.27
|
Source: Morningstar