


The FSA Spy market buzz – 6 June 2025
Animal spirits run wild; Franklin Templeton is taking credit; EM banking revolution; Not all luxury is equal; Death of search and the AI machine; George Soros on wins and much more.
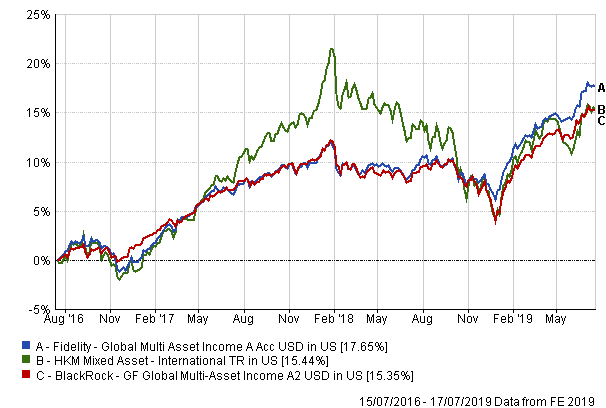
Given that both products have very similar strategies, their performances are also quite similar, according to Claus.
Both products aim to limit downside risks, which explains why they have performed better than peers during down markets, she said.
However, Claus believes that Fidelity places more emphasis on limiting drawdowns.
Discreet calendar performance
| Fund / benchmark |
YTD 2019 |
2018 | 2017 | 2016 | 2015 |
2014 |
| BlackRock GF Global Multi-Asset Income |
9.88 |
-4.89 | 8.66 | 5.34 | -2.35 |
4.11 |
| Fidelity Global Multi Asset Income |
9.82 |
-2.99 | 10.13 | 6.74 | -1.31 |
2.79 |
| Sector : HKM Mixed Asset International |
9.87 |
-9.37 | 17.08 | 1.57 | -4.42 |
1.11 |
In negative periods such as 2018 and 2015, for example, the Fidelity fund performed better than the Blackrock fund.
Because the Fidelity product has the stronger focus on limiting drawdowns, in up markets the expectation is that the Blackrock fund would outperform Fidelity.
“You would expect that, but interestingly, the Fidelity fund has captured more upside over the last years.”
In terms of volatility, Claus pointed out that both products have significantly lower volatility than the category average:
Three-year annualised volatility and Sharpe ratio
| Fund / Index |
Volatility |
Sharpe ratio |
| BlackRock GF Global Multi-Asset Income |
3.53 |
0.38 |
| Fidelity Global Multi Asset Income |
3.64 |
0.56 |
| Sector : HKM Mixed Asset International |
6.72 |
0.24 |
“Over the long-term, they have very similar volatility, but the Fidelity fund has achieved a higher risk-adjusted return.”
 Unmasking the dividend opportunity
 Conditions in the high yield market
 Smartphones on wheels
 Dynamism is the name of the game for this global macro strategy
 China’s post-pandemic growth gathers pace
 Accessing India’s tech future
 Nuveen broadens income sources via private capital and real assets
 Accessing Asian 5G innovation: three key portfolio themes
 Market volatility is creating enticing opportunities for value investors
 Don’t get left behind in fixed income

Animal spirits run wild; Franklin Templeton is taking credit; EM banking revolution; Not all luxury is equal; Death of search and the AI machine; George Soros on wins and much more.
Part of the Mark Allen Group.
