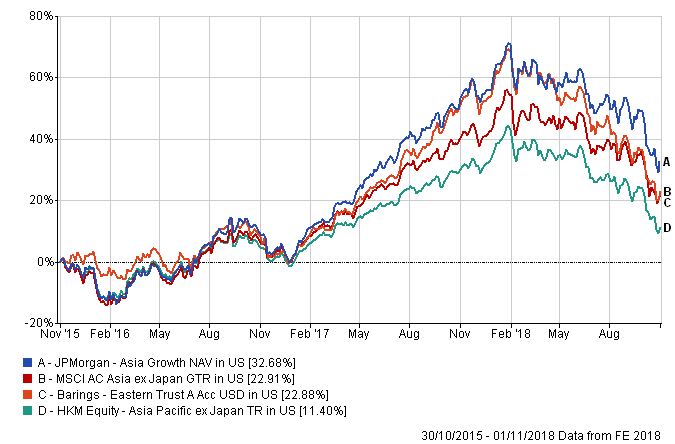
The three-year performance of the Barings and JP Morgan funds versus their benchmark, the MSCI Asia-Pacific ex-Japan index, and their sector.
Performance
Both funds have performed well over the short and long-term, according to Ng, adding that they are rated at the top-end of the Asia-Pacific ex-Japan sector by FE Advisory.
As both funds have a growth tilt, they are expected to outperform the market in growth rallies, such as in 2017, according to Ng.
“The market rally last year was primarily driven by growth companies, including a few internet giants, and in this situation both funds performed well.”
Discreet annual calendar performance
| Fund/benchmark |
2018
|
2017 |
2016 |
2015
|
| Barings Eastern Trust Fund |
-21.97
|
54.86 |
-1.65 |
-1.58
|
| JPMorgan Asia Growth Fund |
-16.47
|
55.52 |
4.06 |
-5.88
|
| Index : MSCI AC Asia ex Japan |
-16.23
|
42.08 |
5.76 |
-8.9
|
Sector : HKM Equity
Asia Pacific ex Japan |
-17.65
|
35.01 |
2.3 |
-8.49
|
Source: FE Analytics
Ng added that outperformance or underperformance of either fund is a result of individual stock selection.
For example, the Barings fund underperformed its benchmark in 2016 because of specific stock selection, particularly positions in materials, consumer discretionary and industrials, he said.
In terms of volatility, Ng expects that both funds will be at similar volatility levels. However, volatility for the two products is higher than the index due to the preference for growth stocks.
|
YTD volatility
|
| Barings Eastern Trust Fund |
19.25
|
| JPMorgan Asia Growth Fund |
18.83
|
| Index : MSCI AC Asia ex Japan |
17.88
|
Source: FE Analytics