


The FSA Spy market buzz – 11 April 2025
Lazard actively looks at Next Gen; Goldman Sachs loves active in small places; Janus Henderson is reassuring; Private equity’s overflowing war chest; Jevons Paradox; Hamlet’s wisdom and much more.
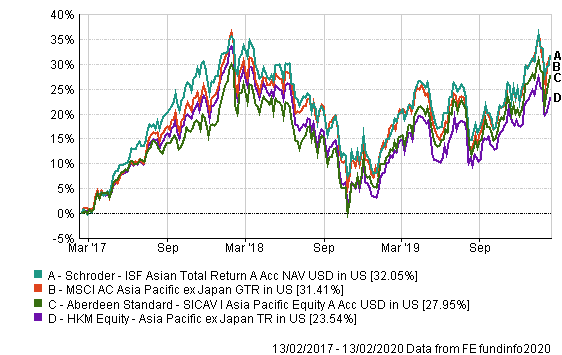
Given that both funds have a quality-bias, Daniels believes that the funds provide downside protection when markets are down.
“But you would expect them to generally lag during bull markets,” he said.
Discrete calendar performance (%)
| Fund / index / sector |
YTD 2020 |
2019 | 2018 | 2017 | 2016 | 2015 | 2014 |
| ASI |
0.89 |
18.67 | -11.2 | 32.45 | 3.76 | -14.92 |
2.11 |
| Schroders |
2.12 |
17.84 | -15.09 | 39.47 | 6.6 | -3.13 |
6.47 |
|
MSCI AC Asia Pacific ex-Japan |
0.72 | 19.48 | -13.68 | 37.32 | 7.06 | -9.12 |
3.09 |
|
HKM Equity – Asia Pacific ex-Japan |
-0.2 | 18.21 | -16.05 | 35.01 | 2.3 | -8.49 |
3.94 |
However, Daniels has more conviction that the Schroders fund will outperform the benchmark and its peers longer-term than the ASI fund.
“We have more conviction in the Schroders fund due to a higher process score.
“There are reasons for the ASI strategy to still outperform [the market], but given the changes in the process in recent years, we do not have the same level of conviction as before,” Daniels said.
In terms of volatility, Daniels expects that the ASI fund is more volatile than the Schroders fund, given that the Schroders option has the hedging feature to keep volatility lower.
Three-year annualised volatility
| Fund / Index |
Volatility |
Sharpe |
| ASI |
13.73 |
0.35 |
| Schroders |
12.8 |
0.45 |
| MSCI AC Asia Pacific ex-Japan |
13.78 |
|
| HKM Equity – Asia Pacific ex-Japan |
13.07 |
 Healthcare’s innovation shifts into high gear
 Accessing Asian 5G innovation: three key portfolio themes
 Investors turn to real estate for alternative income
 China bonds: plugging the yield gap
 Smartphones on wheels
 Ninety One: Finding opportunities in times of change
 Appetite for thematic investments grows amid rates and inflation concerns
 Fixed income – making ground in ESG as ETFs see rapid growth in AUM
 Tech WELLcovered | Work reimagined
 Dynamism is the name of the game for this global macro strategy

Lazard actively looks at Next Gen; Goldman Sachs loves active in small places; Janus Henderson is reassuring; Private equity’s overflowing war chest; Jevons Paradox; Hamlet’s wisdom and much more.
Part of the Mark Allen Group.
