


The FSA Spy market buzz – 6 June 2025
Animal spirits run wild; Franklin Templeton is taking credit; EM banking revolution; Not all luxury is equal; Death of search and the AI machine; George Soros on wins and much more.
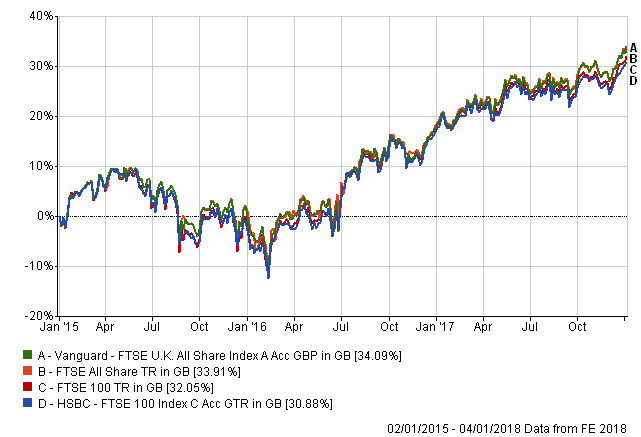
The three-year performance of the HSBC and Vanguard funds versus their benchmark indices, according to FE Analytics.
Both funds have done a good job in tracking their respective benchmarks, according to Bioy. The HSBC fund has a tracking error of less than 0.10%, while the Vanguard fund’s tracking error is 0.04%.
In terms of cumulative performance, the Vanguard fund outperformed the HSBC fund over a three-year period.
The Vanguard fund also outperformed over the longer-term: It has returned 106.12% over a 10-year period versus HSBC’s 90.58%, according to FE data.
“When the UK economy is doing well, mid-caps will do better than large-caps, which gives a nice tailwind to the FTSE All Share Index,” Bioy explained.
However, when there is strong volatility in the UK market, large-cap companies tend to perform better than mid- and small-cap stocks, she said.
Indeed, although the All Share Index outperformed over the long-term, it underperformed the FTSE 100 Index in 2016 after the Brexit vote results.
Discreet annual performance
| Fund / benchmark |
2017 |
2016 | 2015 |
2014 |
| HSBC FTSE 100 |
11.7 |
18 | -1.24 |
0.21 |
| Index : FTSE 100 |
11.95 |
19.07 | -1.32 |
0.74 |
| Vanguard FTSE UK All Share |
13 |
16.58 | 0.89 |
1.05 |
| Index: FTSE All Share |
13.1 |
16.75 | 0.98 |
1.18 |
Source: FE Analytics
In terms of volatility, the HSBC fund’s volatility on a three-year annualised basis is 9.76, while Vanguard’s is 9.36, according to FE data.
 Unmasking the dividend opportunity
 Accessing India’s tech future
 Federated Hermes SDG Engagement Equity: 2021 H1 Report
 Driving decarbonisation: how to access new forms of alpha
 Conditions in the high yield market
 Tech WELLcovered | Work reimagined
 Exciting opportunities in AI & Robotics outside of traditional tech
 Appetite for thematic investments grows amid rates and inflation concerns
 Market volatility is creating enticing opportunities for value investors
 Dynamism is the name of the game for this global macro strategy

Animal spirits run wild; Franklin Templeton is taking credit; EM banking revolution; Not all luxury is equal; Death of search and the AI machine; George Soros on wins and much more.
Part of the Mark Allen Group.
