

The diversity of Asian equity markets provides breadth, depth, and inefficiency for managers to exploit themes, such as AI and other technologies, supply chains, healthcare, and demographics.
As Eastspring Investments notes: the case for long-term investing in Asia is compelling. It is the fastest-growing region and is the world’s largest trading region; its population is almost 60% of the world’s total and the region is becoming a hub for global technology and industrial innovation.
Yet, the region is underrepresented in global financial indices, comprising less than 10% of the MSCI AC World Index.
Many of the Asian markets also offer attractive entry points at current valuations, according to Eastspring Investments. Current valuation levels for the broad Asia index are roughly aligned to the 20-year average, whereas current valuations in major developed markets are well above historical averages.
Amid geopolitical chaos, policy lags, uncertainty over inflation, and the path of interest rates, higher market volatility is inevitable. Stock picking is likely to be key to investing in Asian markets.
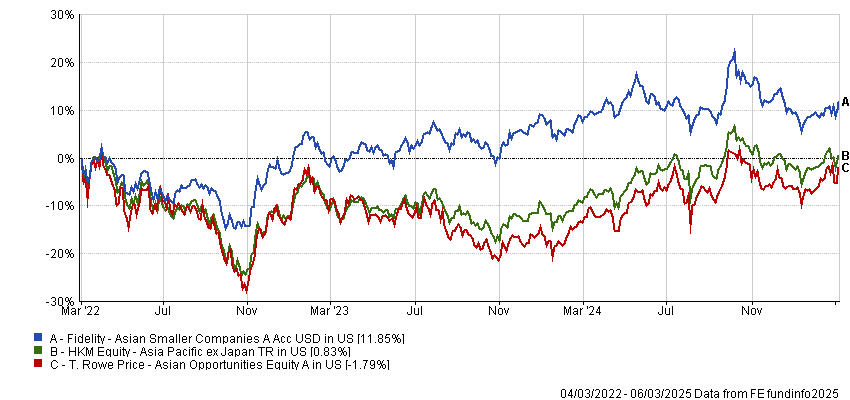
In this context, FSA asked Darius McDermott, managing director of Chelsea Financial Services and FundCalibre, to compare two Asia equity strategies and he selected the Fidelity Asian Smaller Companies fund and the T. Rowe Price Asian Opportunities Equity fund.
| Fidelity | T. Rowe Price | |
| Size | $1.15bn | $139m |
| Inception | 2011 | 2014 |
| Managers | Nitin Bajaj, Ajinkya Dhavale | Jihong Min |
| Three-year cumulative return | 11.85% | -1.79% |
| Three-year annualised return | 3.36% | 0.08% |
| Three-year annualised alpha | 3.03 | -0.14 |
| Three-year annualised volatility | 13.06% | 18.00% |
| Three-year information ratio | 0.47 | -0.07 |
| FE Crown fund rating | *** | ** |
| Morningstar rating | **** | *** |
| OCF | 1.93% | 1.77% |
Investment approach
Both funds focus on stock-picking in Asia, but the resulting portfolios look very different.
“The most obvious difference is on the market cap, with the T. Rowe Price fund focusing across the market cap spectrum (although the manager’s preference for established companies pushes it towards the top end), while the Fidelity fund clearly focuses on small-caps,” said McDermott.
The other difference is style, with the Fidelity fund holding a strong value bias, and the T. Rowe Price fund is style agnostic.
“Jihong Min, alongside the huge research team at T. Rowe Price, target high-quality businesses that will reliably compound earnings and sustain strong cash flow over time. He looks for returns-focused capital allocation and prudent balance sheet management,” said McDermott.
Min takes a long-term approach, believing in the power of compounding. His view is that even modest levels of earnings growth, when allowed to compound over time, can be a powerful driver of returns. Once these high-quality compounders have been identified, valuation is assessed.
“Various valuation criteria are applied to each company, depending on the sector in which it operates,” said McDermott.
While the bottom-up assessment is crucial, top-down factors are also considered, which is another difference between the funds.
The T. Rowe Price team looks at a range of factors, including political stability, government policies, national accounts, central bank policy and currency stability. The final portfolio typically has 40-70 holdings. Turnover has been around 45-55%.
The philosophy behind the Fidelity fund is that small-cap value outperforms growth over time. This has proven to be the case in the Asia ex Japan region, as it has in most of the world.
“Therefore, the fund starts with a contrarian value philosophy,” said McDermott. “However, the team has a flexible rather than dogmatic approach and believes that ‘there is no right or wrong’, when it comes to investing.”
McDermott pointed out that the investment process is “simple common sense”.
Fund managers Nitin Bajaj and Ajinkya Arvind Dhavale aim to buy “good businesses run by good management teams at good prices and then hold them over the long term,” he said.
The emphasis is on buying a business rather than a stock. The universe of opportunity is large with around 13,000 listed small cap stocks in Asia. Ideas come from screens, analysts, company meetings, external brokers and observation. They avoid businesses that are not easily understood, have high valuations and margins relative to history, have high debt and a high percentage of their contracted revenues from a single theme.
The team analyses a company’s business model, its customers, its growth opportunity, its management quality and its historic financial performance.
It also analyses the risk versus potential reward of companies. The managers want to see the potential for a 40-50% upside over three years with a relatively low risk as part of their risk reward analysis. The fund’s active share is typically in excess of 95%.
Looking at the current portfolios the T. Rowe Price fund has a much larger weighting to Taiwan, while the Fidelity fund has a greater exposure to Indonesia. From a sector perspective, the Fidelity fund has overweights to financials and consumer discretionary, and consumer staples sectors.
By contrast, the T. Rowe Price fund has overweights to financials, and “perhaps the biggest difference between the two in terms of sectors is T. Rowe Price’s large relative exposure to technology, which is “a reflection of the value bias of the Fidelity strategy”.
Fund characteristics
Sector allocation:
| Fidelity | weighting | T. Rowe Price | weighting |
| Financials | 17.2% | IT | 29.8% |
| Consumer discretionary | 16.4% | Financials | 27.6% |
| Industrials | 15.6% | Consumer discretionary | 14.7% |
| Consumer staples | 13.5% | Communication services | 12.6% |
| Materials | 10.9% | Industrials & business services | 4.6% |
| Real estate | 7.2% | Real estate | 4.2% |
| IT | 5.6% | Consumer staples | 1.6% |
| Healthcare | 3.9% | Healthcare | 1.0% |
| Energy | 3.7% | ||
| Utilities | 2.3% | ||
| Communication services | 2.2% |
Country allocation:
| Fidelity | weighting | T. Rowe Price | weighting |
| China | 31.7% | China | 29.6% |
| Indonesia | 15.2% | Taiwan | 21.9% |
| South Korea | 12.7% | India | 17.8% |
| India | 12.3% | South Korea | 9.2% |
| Hong Kong | 8.0% | Indonesia | 5.6% |
| Australia | 4.7% | Singapore | 4.4% |
| United States | 3.6% | Philippines | 2.8% |
| Taiwan | 2.4% | Hong Kong | 2.7% |
| Singapore | 1.5% | Vietnam | 1.8% |
| Vietnam | 1.4% | United States | 1.3% |
| Thailand | 1.0% |
Top 10 holdings:
| Fidelity | weighting | T. Rowe Price | weighting |
| Bank Negara Indo | 3.1% | TSMC | 9.9% |
| Indofood | 2.5% | Tencent | 7.0% |
| Axis Bank | 2.5% | Media Tek | 4.8% |
| TSMC | 2.3% | ASE Technology | 4.3% |
| BOC Aviation | 2.3% | Bank Central Asia | 3.2% |
| Genpact | 2.2% | Infosys | 2.9% |
| Federal Bank | 1.9% | AIA | 2.7% |
| Japfa Comfeed Indo | 1.9% | Ping An | 2.7% |
| Crystal International | 1.7% | Hongfa Technology | 2.5% |
| Sinotrans | 1.6% | Alibaba | 2.5% |
Performance
Discrete calendar year performance
| YTD* | 2024 | 2023 | 2022 | 2021 | 2020 | |
| Fidelity | 2.00% | 0.49% | 12.27% | -6.99% | 14.29% | 13.86% |
| T. Rowe Price | 5.14% | 9.20% | -1.79% | -19.46% | -5.51% | 26.78% |
| Sector | 2.80% | 7.90% | 3.63% | -19.04% | 0.11% | 21.83% |
Manager review
Both are asset managers are “big players, backed by huge teams of analysts in this market,” said McDermott.
Nitin Bajaj joined Fidelity in 2003 as a research analyst in London. After achieving notable success and high ratings in research, he transitioned to the role of assistant portfolio manager in 2007, focusing on the Fidelity Global Special Situations fund in the UK.
In 2009, Bajaj moved to Mumbai to manage Fidelity’s domestic Indian equity funds. He later relocated to Singapore in 2012 to manage the Fidelity Asian Smaller Companies fund (SICAV). Since April 2015, he has also managed the Fidelity Asian Values PLC, applying the same contrarian value philosophy and approach. He is joined on the fund by co-manager Ajinkya Dhavale.
Jihong Min became lead manager on the T. Rowe Price fund in April 2022, but has been with the firm since 2012. With investment experience dating back to 2003, Min previously worked as an analyst at Fortress Investment Group and Geosphere Capital, focusing on Asian financials, and started his career in J.P. Morgan’s Investment Banking Division in New York.
Fees
The T. Rowe Price fund has an ongoing charge of 1.77%, while the Fidelity fund is slightly more at 1.92%, according to FE fundinfo. Neither are particularly expensive for the asset class.
Conclusion
“It is hard to argue against the performance of the Fidelity fund,” said McDermott.
It is high risk and there are periods where the value style of investing will go out of favour. But the process has been proven to be successful time and time again over the long term.
“As fund analysts there’s not much more we can ask for; an experienced manager, a strong process, a great track record and backed up by the infrastructure and research capability of a very capable fund house” he said.
However, the T. Rowe Price fund is an “interesting offering”.
It has been a challenging time for managers in this region given the important calls which it has been necessary to make on both China and India. Being on the wrong side of that trade to any degree will hurt – but the focus on high quality companies run by high quality people and holding them for the long term has proven fruitful for the T. Rowe Price fund.
“Min also has the backing of a strong analyst team on the ground, which is beneficial. We are confident that he can deliver good performance in the future and the fund is one we are watching closely and could potentially complement the Fidelity offering,” concluded McDermott.