Some of the best performing US growth funds of last year are suffering from double digit losses in the span of just a few weeks, according to data compiled from FE fundinfo*.
After two back-to-back years of outsized gains in 2023 and 2024, some US growth equity strategies are down 25% from their highs.
The best performing funds of last year were hit the hardest, where all of the top-20 performers are down 10% or more from their highs.
Below, FSA highlights the year-to-date and 2024 performance figures of last year’s top-20 US equity funds available for investors in Hong Kong and Singapore.
| Fund | 3-week performance (%) | YTD performance (%) | 2024 performance (%) | 2023 performance (%) |
| Alger Focus Equity | -15.21 | -7.36 | 51.82 | 43.54 |
| Alger Alger American Asset Growth | -15.03 | -7.45 | 46.09 | 41.06 |
| MS INVF US Growth | -25.73 | -13.42 | 41.16 | 49.29 |
| MS INVF US Insight | -26.09 | -13.66 | 40.94 | 52.26 |
| T. Rowe Price US Blue Chip Equity | -13.45 | -9.57 | 35.26 | 49.62 |
| Nomura American Century US Focused Innovation Equity | -15.75 | -14.77 | 34.81 | 36.65 |
| LGT PB U.S. Equity | -10.33 | -5.8 | 34.61 | 48.5 |
| iShares Core S&P U.S. Growth ETF | -9.36 | -4.9 | 34.34 | 28.45 |
| iShares Russell 1000 Growth ETF | -8.99 | -5.59 | 33.11 | 42.41 |
| JPM US Growth | -11.9 | -9.14 | 33.02 | 34.78 |
| iShares iShares MSCI USA Momentum Factor ETF TR | -10.5 | -1.25 | 32.88 | 9.1 |
| Natixis Loomis Sayles US Growth Equity | -13.06 | -9.34 | 32.82 | 49.56 |
| JPM US Growth | -11.98 | -9.3 | 32.09 | 33.82 |
| New Capital US Growth | -11.7 | -6.18 | 31.58 | 47.99 |
| T. Rowe Price US Large Cap Growth Equity Fund | -12.05 | -8.26 | 31.27 | 48.64 |
| UBS (Lux) Equity SICAV USA Growth (USD) | -10.14 | -6.68 | 30.57 | 42.43 |
| MS INVF US Advantage | -17.76 | -7.01 | 30.38 | 44.56 |
| BlackRock GF US Growth | -14.74 | -12.05 | 30.14 | 52.68 |
| iShares S&P 100 ETF | -6.2 | -2.7 | 29.96 | 31.77 |
| Artisan US Focus | -8.3 | -0.58 | 29.53 | 14.54 |
Funds with large positions in US big tech stocks have suffered the brunt of the recent sell-off, including passive exchange-traded-funds (ETFs).
The iShares Core S&P US Growth ETF and the iShares Russell 1000 Growth ETF are both down almost 10% from their highs.
These funds track a basket of US growth stocks, which at the start of the year included a 12% weighting to Nvidia.
But these funds have been dragged down in recent weeks as shares in the semiconductor firm have fallen over 20% since the start of the year.
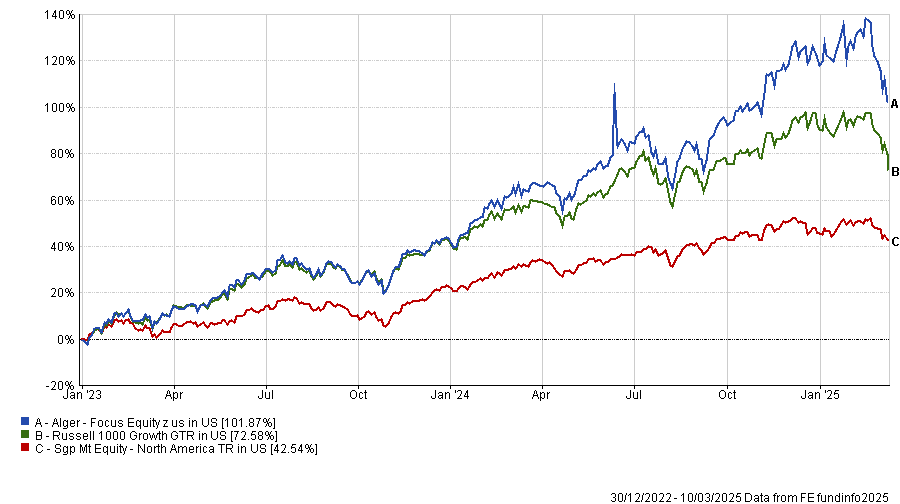
The Alger Focus Equity strategy, which was the top-performer last year on the back of its investments in Nvidia and other US growth stocks, has also seen its largest positions decline significantly year-to-date.
The strategy benefitted immensely from an overweight position in AppLovin which surged over ten-fold over the course of 2024. But shares in the mobile software company have since declined over 50% from its peak.
Performance of fund since 2023
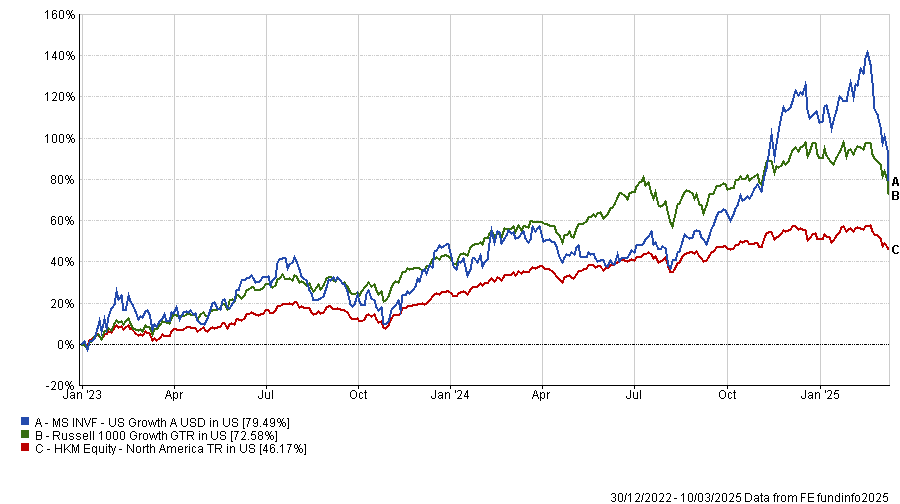
Morgan Stanley’s US Growth and US Insight strategies have also been hard hit over the past few weeks.
These strategies were among the highest performers in 2023 and 2024, up some 50% and 40% respectively.
But an overweight position in Tesla has been a drag for both strategies year-to-date, as shares in the electric vehicle manufacturer have declined over 50% from their peak late last year.
Performance of fund since 2023
Conversely, some of the best performing US equity strategies year-to-date were the laggards of the past few years. These include various low volatility and dividend-focused ETFs.
*The performance figures are based in US dollars. The data only includes funds that fall under the Singapore and Hong Kong equity sectors according to FE fundinfo data.