
Based on the popular 80s card game, each week we select an asset class and use FE fundinfo data to compare two funds based on their three-year performance, assets under management, alpha, volatility, ongoing charges and information ratio to decide which is the Top Trump.
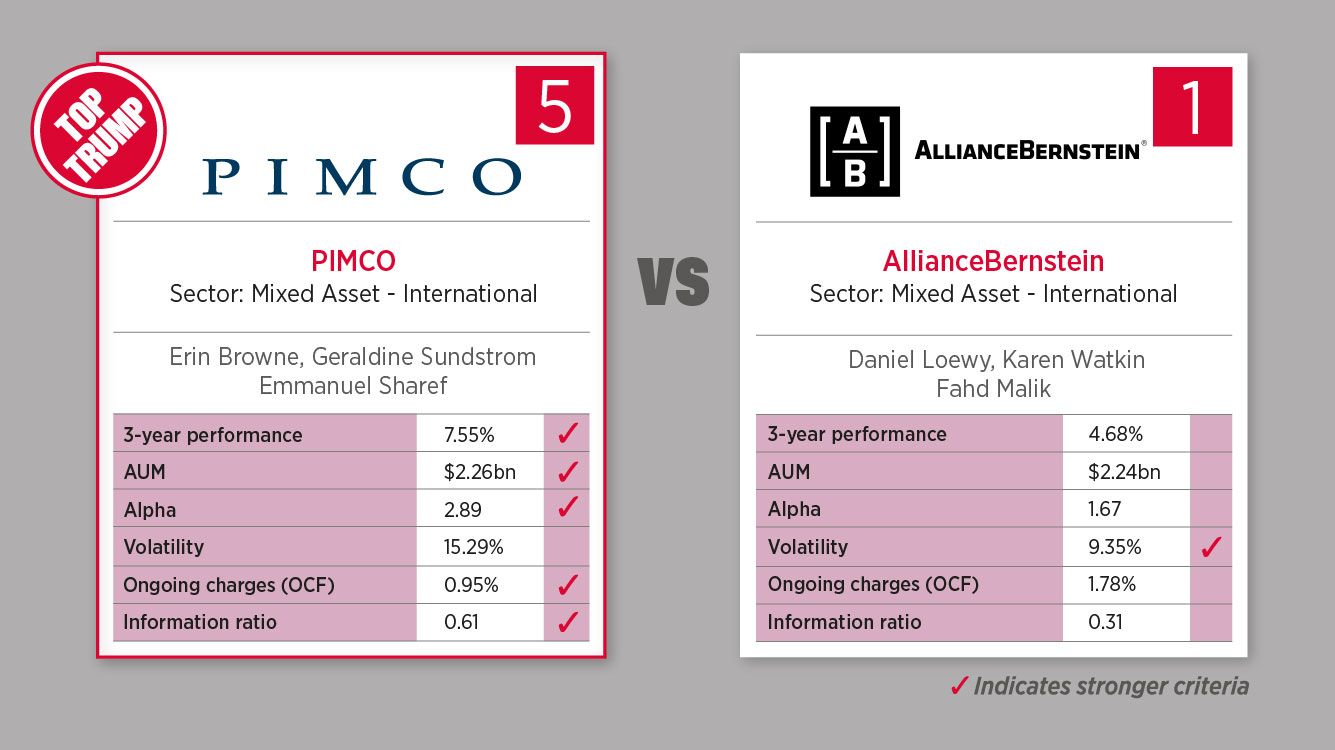
This week, the PIMCO GIS Balanced Income and Growth beats the AB All Market Income Portfolio: 5-1
PIMCO GIS Balanced Income and Growth
This fund uses a global multi-sector strategy to combine total return and income maximisation.
Top 10 holdings:
FNMA TBA 6.5% FEB 30YR (4.8%)
FNMA TBA 6.0% FEB 30YR (3%)
MICROSOFT CORP (2.4%)
FNMA TBA 5.5% FEB 30YR (2/3%)
APPLE INC (2%)
U S TREASURY NOTE (1.7%)
AMAZON.COM INC (1.6%)
META PLATFORMS INC-CLASS A (1.5%)
CISCO SYSTEMS INC (1.4%)
ALPHABET INC-CL A (1.2%)
Ninety One Global Equity
This fund aims for income generation and long-term growth by investing across fixed income, global equities and non-traditional assets and strategies.
Top 10 holdings:
Apple (1.71%)
Microsoft (1.68%)
NVIDIA (1.57%)
Amazon (0.9%)
Alphabet (0.86%)
CCO Holdings 4.25%, 02/01/31 – 01/15/34 (0.49%)
AB Emerging Market Corporate Debt Portfolio (0.3%)
American Airlines/AAdvantage 5.75%, 04/20/29 (0.19%)
FHLM 9.268%, 02/25/50 (0.19%)
Warnermedia Holdings 4.279%, 03/15/32 (0.16%)


 equities - 15 May 2025")