

Asian equities underperformed last year relative to their global peers, but there are strong reasons to consider allocating to them this year, according to strategists.
For one thing, according to research from JP Morgan, from a price-to-book perspective, most regions are trading more than one standard deviation below their 15-year averages.
Asian earnings also remain highly correlated to export growth, which is expected to rise this year as the global economy avoids a recession.
Depending on where you turn your attention as well, there are good reasons to be bullish on multiple regions in this part of the world.
In India, the IMF recently raised its projected growth for the country in 2023 such has been the economy’s buoyancy as more multinationals look to diversify away from China.
Last year also belonged to semiconductors as the previous year’s sell-off due to inventory fears gave way to AI-driven euphoria, lifting the performance of Korean and Taiwanese stocks in particular, and there is little reason to believe this will come to an end anytime soon.
Even in China, whose performance last year was a drag on the region’s returns, there were green shoots of recovery, particularly in the energy sector.
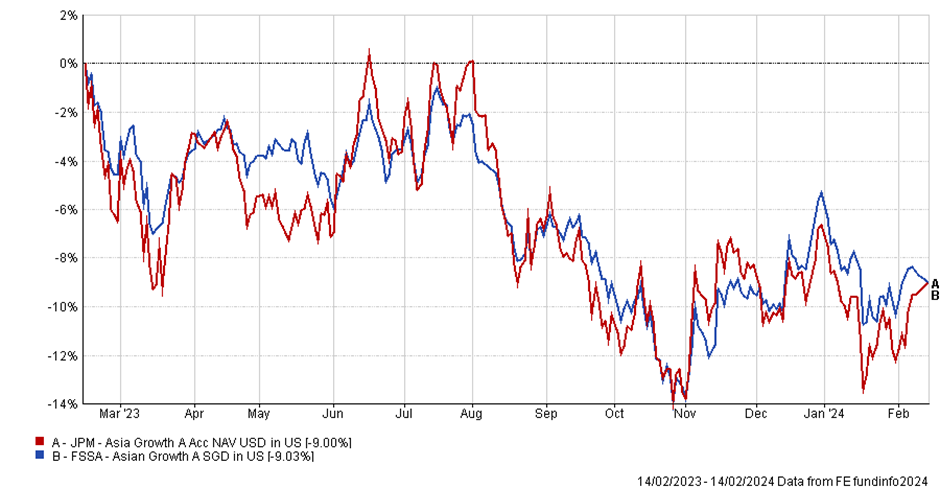
Against this background, Isaac Poole, chief investment officer at Oreana Financial Services, chose the FSSA Asian Growth Fund Class A Accumulation fund and the JP Morgan Funds – Asia Growth fund for this week’s head to head.
| FSSA | JP Morgan | |
| Size | $38m | $775.7m |
| Inception | 1984 | 2005 |
| Managers | Richard Jones, Rizi Mohanty | Mark Davids, Joanna Kwok |
| Three-year cumulative return | -7.06% | -14.76% |
| Three-year annualised return | -8.4% | -16.35% |
| Three-year annualised alpha | -0.4 | -5.51 |
| Three-year annualised volatility | 13.83 | 18.47 |
| Three-year information ratio | 0.12 | -1.27 |
| FE Crown fund rating | *** | * |
| OCF (retail share class) | 1.5% | 1.75% |
Investment approach
The FSSA strategy takes a bottom-up approach with a focus on quality companies, namely those with effective management, strong franchises and the ability to generate long-term growth.
“Management quality is critical and the team’s focus on it is uncompromising – which can lead to significant deviations from benchmark sector and country weightings,” said Poole.
The fund is able to invest in companies listed outside Asia provided the majority of its sales or profits are generated from the region, although the proportion of companies that fit this description typically falls below 10% of the portfolio.
Overall, the portfolio is fairly concentrated with around 30 to 60 stocks. Turnover is typically low, usually around 30%.
In contrast, the JP Morgan strategy has a focus on quality growth, with companies that enjoy structural growth potential as well as have a strong franchise.
“The process is clear and repeatable, delivering a portfolio of 40-60 names, with a clear risk management process,” said Poole.
Poole notes that the portfolio allows for active exposure of individual positions at +5% or -5% relative to the MSCI AC Asia ex-Japan index, which is more constrained than the FSSA strategy.
Turnover for the JP Morgan strategy is also quite low at around 30%-60%.
“While both portfolios factor management quality into the decision process, the FSSA approach has led it to avoid some key markets within Asia, taking bigger positions outside of the index. This remains a key difference between the portfolios – JPM has a materially higher exposure to China and HK compared against FSSA,” said Poole.
Country allocation:
| FSSA | JP Morgan | ||
| India | 33% | China | 26.3% |
| China | 14.3% | India | 21.1% |
| Hong Kong | 12.4% | Taiwan | 18.5% |
| Taiwan | 12% | Korea | 13.7% |
| Singapore | 7.4% | Hong Kong | 9.6% |
| Indonesia | 6.1% | Indonesia | 5.8% |
| Japan | 6% | Singapore | 2.2% |
| Korea | 3.2% | Vietnam | 1.6% |
| USA | 2.8% | Cash | 1.2% |
| Philippines | 1.4% | ||
| Other | 1.2% | ||
| Liquidity | 0.2% |
Sector allocation:
| FSSA | JP Morgan | ||
| Financials | 24.5% | Information Technology | 33.2% |
| Consumer Staples | 22.4% | Financials | 29.2% |
| Information Technology | 21.4% | Consumer Discretionary | 11.6% |
| Industrials | 8.6% | Communication Services | 10.5% |
| Consumer Discretionary | 8.2% | Consumer Staples | 6.7% |
| Communications Services | 7.3% | Industrials | 4.5% |
| Materials | 4.7% | Healthcare | 1.9% |
| Healthcare | 1.6% | Materials | 1.2% |
| Real Estate | 1.2% | Cash | 1.2% |
| Liquidity | 0.02 |
Performance
Poole notes that the FSSA fund has strong downside resilience, which is a reflection of the emphasis on quality within the portfolio, albeit the downside is that this can lead to underperformance during rallies.
As a result of the focus on quality, the strategy has historically been underweight China because of governance issues there, which has helped its performance in recent years.
“Returns have been relatively strong over the past three years and drawdowns have been well below the market – helped by avoiding China, which has been a big underperformer over that period. That has also helped keep volatility low relative to peers,” he said.
Poole notes that the performance of the JP Morgan fund has been strong since the new managers took over in 2017, albeit the focus on growth has led to elevated volatility.
“Returns have been strong over time, even with the challenge that a growth bias has faced since 2021. An exposure to China was painful in 2022, as was a broader exposure to real estate and consumer discretionary. While 2023 rounds out a challenging three years for the fund, this needs to be taken in the context of a difficult period for both the growth bias and the region,” he said.
Overall, he notes that the two funds perform differently under different circumstances.
“Over a longer period, JPM’s ability to capitalise on recoveries and rallies in Asian markets stands out. 2017, 2019 and 2020 are examples of this – while for FSSA, the ability to protect on the downside in 2022 and 2023 is clear in the numbers,” he said.
Discrete calendar year performance
| Fund | YTD* | 2023 | 2022 | 2021 | 2020 |
| FSSA | -1.48% | -0.81% | -16.95% | 5.28% | 15.42% |
| JP Morgan | -2.52% | -0.3% | -24.15% | -7.88% | 34.26% |
Manager review
The FSSA fund is led by Richard Jones, who has helmed the strategy since 2014. Jones joined FSSA in 2010 and has close to 30 years of experience.
He is supported by Rizi Mohanty, who joined FSSA as senior investment analyst in 2016 before being promoted to portfolio manager in 2020.
The duo are supported by a wider investment team of about 20 professionals and while there has been some turnover, support is adequate, Poole notes.
“Both are exceptional investors – Rizi has joined recently but we have met him in other roles and hold him in high esteem,” said Poole.
The JP Morgan strategy is led by Mark Davids and Joanna Kwok, who are supported by JP Morgan’s wider team, which Poole notes is critical.
Davids serves as co-head of the Asia Pacific regional team within the emerging markets and Asia Pacific equities team and joined the firm in 1997.
Kwok is a portfolio manager within the same team and joined the firm in 2002.
“Both strategies have very experienced investors and are supported by a very impressive analyst pool. These are big firms, well able to support the managers in expressing and repeatably implementing their investment processes,” said Poole.
Conclusion
Poole is clearly impressed with both funds, singling out their impressive investment managers and clear investment processes.
He notes that with a similar concentration and high conviction, both funds could play an important role within a portfolio.
“While investing in Asia has been difficult as developed markets have surged through 2023 and the start of 2024, we continue to think Asia can play a role in client portfolios,” he said.
Overall, he notes it comes down to what asset allocators think the outlook for Asia will be given that the JP Morgan fund tends to thrive during bull markets, while the FSSA fund is a better choice to protect against the downside.
“We remain cautious on the outlook and more broadly have reduced our Asian exposure, but within that we could see a role for both managers depending on the underlying risk profile of the investor,” he said.